
Predicting Heart Disease with Machine Learning – Dataquest
In this tutorial, we’ll walk through a complete machine learning project to predict the likelihood of heart disease in patients. As a data scientist working for a healthcare solutions company, your goal is to analyze patient data and build a model that can help identify individuals at risk for heart disease. This project combines data cleaning, exploratory data analysis, feature selection, and model building—all valuable skills for aspiring data professionals.
By the end of this tutorial, you’ll have built a machine learning model that can predict heart disease with over 80% accuracy, and you’ll understand each step of the machine learning workflow from start to finish.
What You’ll Learn
Through this project, you’ll practice:
- Cleaning and preprocessing medical data
- Visualizing data patterns using
matplotlibandseaborn - Selecting relevant features using correlation analysis
- Building and optimizing a K-Nearest Neighbors classifier
- Evaluating model performance using confusion matrices
- Fine-tuning model hyperparameters with
GridSearchCV
Before You Start: Pre-Instruction
To make the most of this project walkthrough, follow these preparatory steps:
- Review the Project
Access the project and familiarize yourself with the goals and structure: Heart Disease Prediction Project. - Prepare Your Environment
- If you’re using the Dataquest platform, everything is already set up for you.
- If you’re working locally, ensure you have Python and Jupyter Notebook installed, along with the required libraries:
pandas,numpy,matplotlib,seaborn, andsklearn. - For this, you’ll need the
heart_disease_prediction.csvdataset, which contains anonymized patient data from multiple hospitals. This dataset is from the Heart Failure Prediction Dataset on Kaggle.
- Get Comfortable with Jupyter
- New to Markdown? We recommend learning the basics to format headers and add context to your Jupyter notebook: Markdown Guide.
- For file sharing and project uploads, create a GitHub account: Sign Up on GitHub.
Setting Up Your Environment
Before we dive into the analysis, let’s set up our environment. This project requires several Python libraries:
import pandas as pd
import numpy as np
import matplotlib.pyplot as plt
import seaborn as sns
from sklearn.preprocessing import MinMaxScaler
from sklearn.model_selection import train_test_split, GridSearchCV
from sklearn.neighbors import KNeighborsClassifier
from sklearn.metrics import accuracy_score, confusion_matrix, ConfusionMatrixDisplay

%matplotlib inline
Learning Insight: While importing
pandasandnumpywith aliases (pd,np) is standard practice, note how we import specific classes and functions from scikit-learn modules rather than the entire library. This approach is common with scikit-learn because it’s an extensive library with many modules. Importing only what you need keeps your code clean and improves readability.
Now that we have our libraries imported, let’s load the dataset and begin our analysis:
heart_df = pd.read_csv('heart_disease_prediction.csv')
heart_df.head()| Age | Sex | ChestPainType | RestingBP | Cholesterol | FastingBS | RestingECG | MaxHR | ExerciseAngina | Oldpeak | ST_Slope | HeartDisease |
|---|---|---|---|---|---|---|---|---|---|---|---|
| 40 | M | ATA | 140 | 289 | 0 | Normal | 172 | N | 0.0 | Up | 0 |
| 49 | F | NAP | 160 | 180 | 0 | Normal | 156 | N | 1.0 | Flat | 1 |
| 37 | M | ATA | 130 | 283 | 0 | ST | 98 | N | 0.0 | Up | 0 |
| 48 | F | ASY | 138 | 214 | 0 | Normal | 108 | Y | 1.5 | Flat | 1 |
| 54 | M | NAP | 150 | 195 | 0 | Normal | 122 | N | 0.0 | Up | 0 |
Great! We’ve successfully loaded our dataset. Let’s examine its structure to get a better understanding of what we’re working with:
heart_df.info()<class 'pandas.core.frame.DataFrame'>
RangeIndex: 918 entries, 0 to 917
Data columns (total 12 columns):
# Column Non-Null Count Dtype
--- ------ -------------- -----
0 Age 918 non-null int64
1 Sex 918 non-null object
2 ChestPainType 918 non-null object
3 RestingBP 918 non-null int64
4 Cholesterol 918 non-null int64
5 FastingBS 918 non-null int64
6 RestingECG 918 non-null object
7 MaxHR 918 non-null int64
8 ExerciseAngina 918 non-null object
9 Oldpeak 918 non-null float64
10 ST_Slope 918 non-null object
11 HeartDisease 918 non-null int64
dtypes: float64(1), int64(6), object(5)
memory usage: 86.2+ KBOur dataset contains 918 patient records with 12 features:
- Age: Patient’s age in years
- Sex: Patient’s gender (M/F)
- ChestPainType: Type of chest pain (ATA, NAP, ASY, TA)
- RestingBP: Resting blood pressure in mm Hg
- Cholesterol: Cholesterol level in mg/dL
- FastingBS: Fasting blood sugar level (1 if > 120 mg/dL, otherwise 0)
- RestingECG: Resting electrocardiogram results
- MaxHR: Maximum heart rate achieved during exercise
- ExerciseAngina: Exercise-induced angina (Y/N)
- Oldpeak: ST depression induced by exercise relative to rest
- ST_Slope: ST segment slope during stress test (Up, Flat, Down)
- HeartDisease: Target variable (1 = heart disease, 0 = no heart disease)
We have a mix of numerical and categorical features. The categorical features (objects) will need to be encoded before we can use them in our model.
Let’s also look at the summary statistics of the numerical features:
heart_df.describe()| Statistic | Age | RestingBP | Cholesterol | FastingBS | MaxHR | Oldpeak | HeartDisease |
|---|---|---|---|---|---|---|---|
| count | 918.000000 | 918.000000 | 918.000000 | 918.000000 | 918.000000 | 918.000000 | 918.000000 |
| mean | 53.510893 | 132.396514 | 198.799564 | 0.233115 | 136.809368 | 0.887364 | 0.553377 |
| std | 9.432617 | 18.514154 | 109.384145 | 0.423046 | 25.460334 | 1.066570 | 0.497414 |
| min | 28.000000 | 0.000000 | 0.000000 | 0.000000 | 60.000000 | -2.600000 | 0.000000 |
| 25% | 47.000000 | 120.000000 | 173.250000 | 0.000000 | 120.000000 | 0.000000 | 0.000000 |
| 50% | 54.000000 | 130.000000 | 223.000000 | 0.000000 | 138.000000 | 0.600000 | 1.000000 |
| 75% | 60.000000 | 140.000000 | 267.000000 | 0.000000 | 156.000000 | 1.500000 | 1.000000 |
| max | 77.000000 | 200.000000 | 603.000000 | 1.000000 | 202.000000 | 6.200000 | 1.000000 |
Learning Insight: Always check summary statistics when starting a data analysis project. It helps identify potential data issues, such as unusual minimum/maximum values, and gives you a feel for the data distribution. Here, we can immediately spot potential problems: both RestingBP and Cholesterol have minimum values of 0, which seems physiologically impossible and could indicate missing data.
Exploratory Data Analysis (EDA)
Before we start building our model, let’s explore the dataset further to understand the patterns and relationships within our data. We’ll start by visualizing the categorical variables:
categorical_cols = ["Sex", "ChestPainType", "FastingBS", "RestingECG", "ExerciseAngina", "ST_Slope", "HeartDisease"]

fig = plt.figure(figsize=(16,15))

for idx, col in enumerate(categorical_cols):
    ax = plt.subplot(4, 2, idx+1)
    sns.countplot(x=heart_df[col], ax=ax)
    # add data labels to each bar
    for container in ax.containers:
        ax.bar_label(container, label_type="center")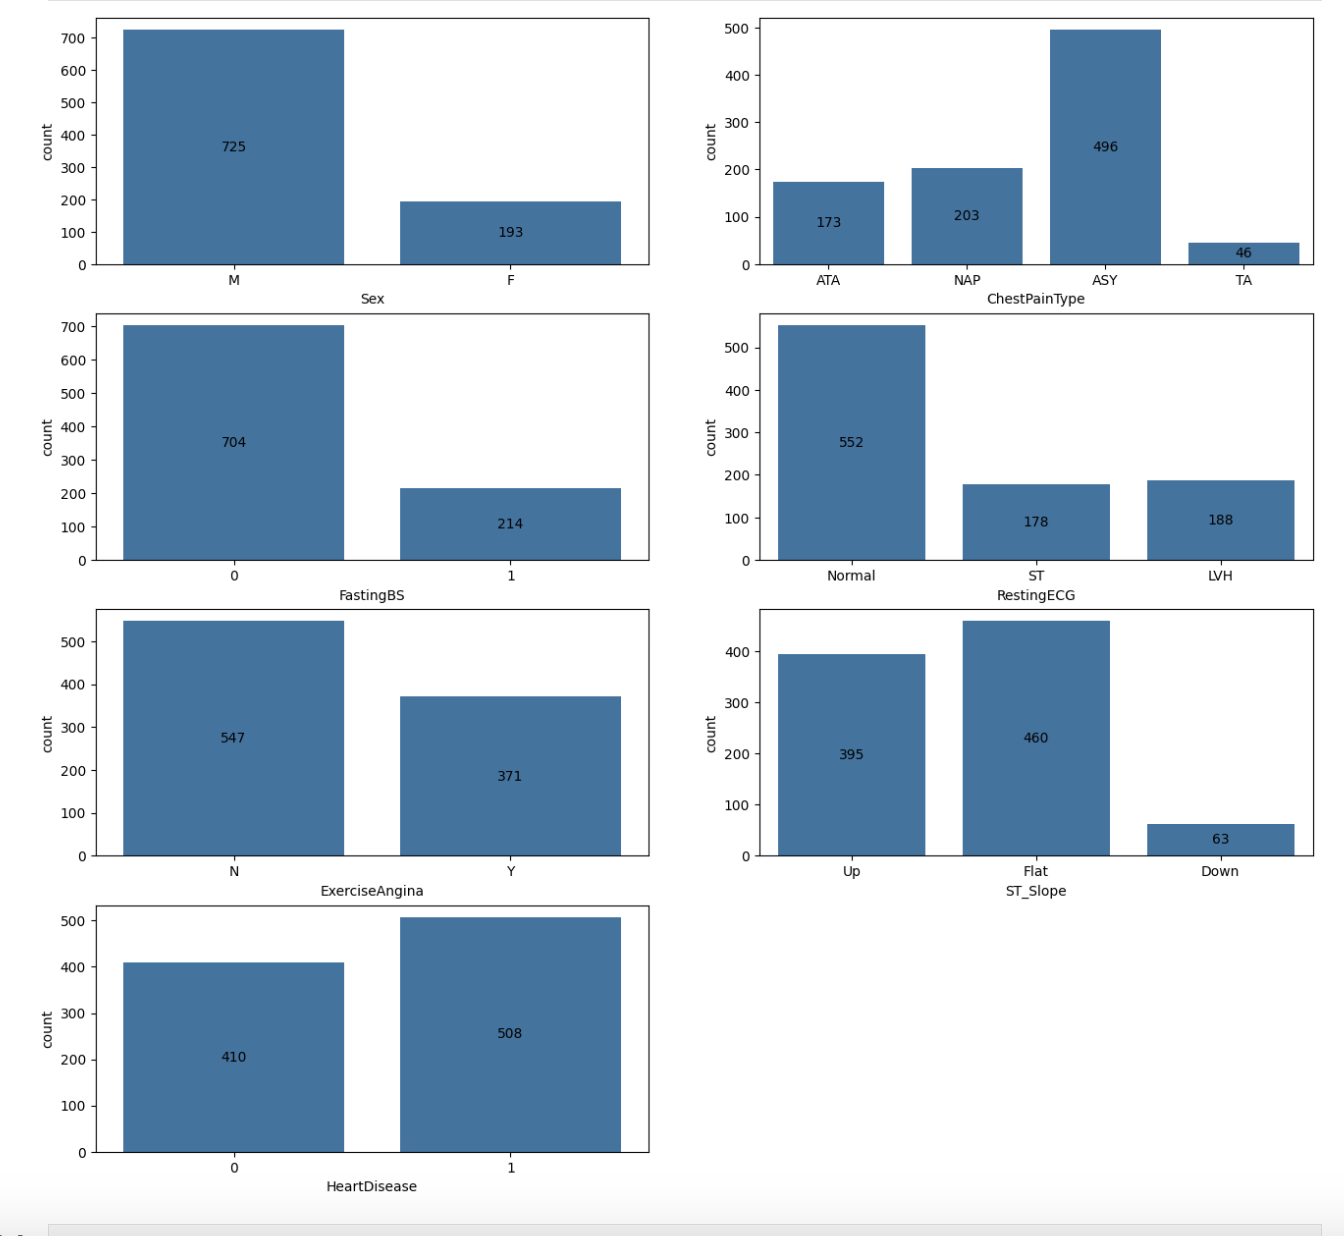

These count plots give us insights into the distribution of our categorical variables:
- Sex: The dataset contains significantly more males (725) than females (193)
- ChestPainType: “ASY” (asymptomatic) is the most common chest pain type
- FastingBS: Most patients have normal fasting blood sugar levels (0)
- RestingECG: “Normal” is the most common result
- ExerciseAngina: Most patients do not experience exercise-induced angina
- ST_Slope: “Flat” and “Up” are the most common, with very few “Down” cases
- HeartDisease: The target variable is reasonably balanced, with slightly more positive cases
Next, let’s see how these categorical variables relate to the presence of heart disease:
fig = plt.figure(figsize=(16,15))

for idx, col in enumerate(categorical_cols[:-1]):
    ax = plt.subplot(4, 2, idx+1)
    # group by HeartDisease
    sns.countplot(x=heart_df[col], hue=heart_df["HeartDisease"], ax=ax)
    # add data labels to each bar
    for container in ax.containers:
        ax.bar_label(container, label_type="center")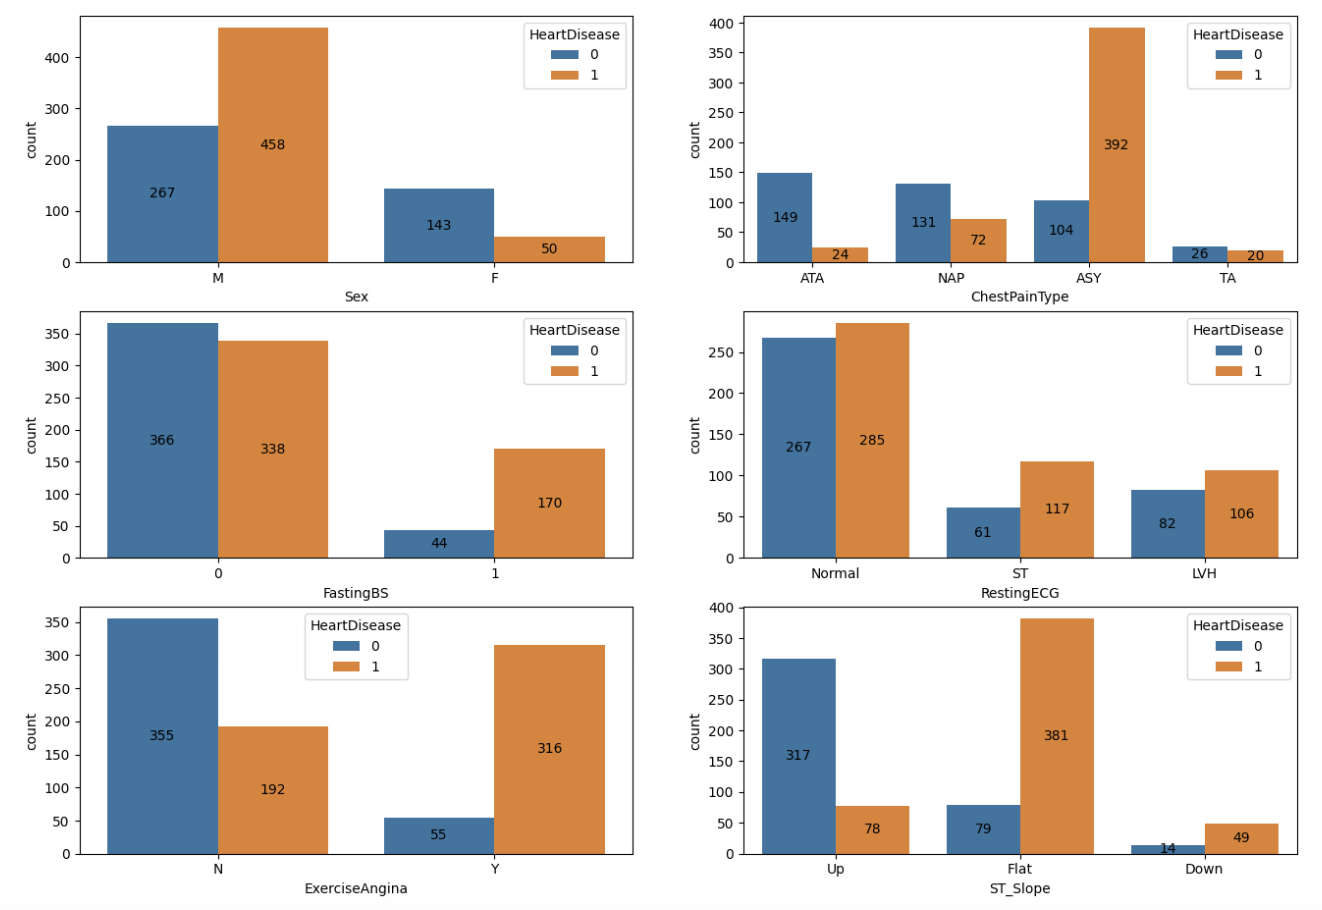

These visualizations reveal several interesting patterns:
- Sex: Males have a higher prevalence of heart disease in this dataset
- ChestPainType: “ASY” (asymptomatic) is strongly associated with heart disease
- FastingBS: Higher fasting blood sugar is associated with heart disease
- RestingECG: “ST” type is more associated with heart disease than the “Normal” type
- ExerciseAngina: Strong association between exercise-induced angina (”Y”) and heart disease
- ST_Slope: “Flat” slope is strongly associated with heart disease, while “Up” slope is associated with no heart disease
Learning Insight: Visualizing how categorical variables relate to your target variable is key to understanding potential predictors. These patterns can guide your feature selection process and help you build more effective models.
Data Cleaning
During our exploratory analysis, we identified potential issues with the RestingBP and Cholesterol variables, which both had minimum values of 0. Let’s investigate these further:
heart_df[heart_df['RestingBP']==0].info()<class 'pandas.core.frame.DataFrame'>
Index: 1 entries, 449 to 449
Data columns (total 12 columns):
# Column Non-Null Count Dtype
--- ------ -------------- -----
0 Age 1 non-null int64
1 Sex 1 non-null object
2 ChestPainType 1 non-null object
3 RestingBP 1 non-null int64
4 Cholesterol 1 non-null int64
5 FastingBS 1 non-null int64
6 RestingECG 1 non-null object
7 MaxHR 1 non-null int64
8 ExerciseAngina 1 non-null object
9 Oldpeak 1 non-null float64
10 ST_Slope 1 non-null object
11 HeartDisease 1 non-null int64
dtypes: float64(1), int64(6), object(5)
memory usage: 104.0+ bytesThere’s only one patient with a RestingBP of 0, which is clearly a data entry error or missing value. Now let’s check Cholesterol:
heart_df[heart_df['Cholesterol']==0].info()<class 'pandas.core.frame.DataFrame'>
Index: 172 entries, 293 to 536
Data columns (total 12 columns):
# Column Non-Null Count Dtype
--- ------ -------------- -----
0 Age 172 non-null int64
1 Sex 172 non-null object
2 ChestPainType 172 non-null object
3 RestingBP 172 non-null int64
4 Cholesterol 172 non-null int64
5 FastingBS 172 non-null int64
6 RestingECG 172 non-null object
7 MaxHR 172 non-null int64
8 ExerciseAngina 172 non-null object
9 Oldpeak 172 non-null float64
10 ST_Slope 172 non-null object
11 HeartDisease 172 non-null int64
dtypes: float64(1), int64(6), object(5)
memory usage: 17.5+ KBWe have 172 patients with a Cholesterol value of 0, which is approximately 19% of our dataset. This is a significant number of records, so we’ll need to handle these values carefully.
Let’s clean our data by:
- Removing the one record with RestingBP = 0
- Replacing Cholesterol = 0 values with the median Cholesterol value, calculated separately for patients with and without heart disease
df_clean = heart_df.copy()

# Remove the record with RestingBP = 0
df_clean = df_clean[df_clean["RestingBP"] != 0]

# Create a mask for patients without heart disease
heartdisease_mask = df_clean["HeartDisease"]==0

# Get cholesterol values for patients with and without heart disease
cholesterol_without_heartdisease = df_clean.loc[heartdisease_mask, "Cholesterol"]
cholesterol_with_heartdisease = df_clean.loc[~heartdisease_mask, "Cholesterol"]

# Replace cholesterol = 0 values with the median for the respective group
df_clean.loc[heartdisease_mask, "Cholesterol"] = cholesterol_without_heartdisease.replace(to_replace = 0, value = cholesterol_without_heartdisease.median())
df_clean.loc[~heartdisease_mask, "Cholesterol"] = cholesterol_with_heartdisease.replace(to_replace = 0, value = cholesterol_with_heartdisease.median())

# Verify our cleaning worked
df_clean[["Cholesterol", "RestingBP"]].describe()| Statistic | Cholesterol | RestingBP |
|---|---|---|
| count | 917.000000 | 917.000000 |
| mean | 239.700109 | 132.540894 |
| std | 54.352727 | 17.999749 |
| min | 85.000000 | 80.000000 |
| 25% | 214.000000 | 120.000000 |
| 50% | 225.000000 | 130.000000 |
| 75% | 267.000000 | 140.000000 |
| max | 603.000000 | 200.000000 |
Learning Insight: When dealing with missing or invalid values, it’s important to consider the context. For Cholesterol, we replaced zeros with the median value from patients with the same heart disease status, rather than the overall median. This approach preserves any potential relationship between cholesterol levels and heart disease. For RestingBP, since there was only one invalid record, removal was the simplest solution.
Feature Selection
Now that our data is clean, we need to prepare it for our machine learning model. K-Nearest Neighbors requires numeric input, so we’ll need to convert our categorical variables. We’ll use one-hot encoding to transform these variables into numeric form:
# One-hot encode categorical variables
df_clean = pd.get_dummies(df_clean, drop_first=True)
df_clean.head()| Age | RestingBP | Cholesterol | FastingBS | MaxHR | Oldpeak | HeartDisease | Sex_M | ChestPainType_ATA | ChestPainType_NAP | ChestPainType_TA | RestingECG_Normal | RestingECG_ST | ExerciseAngina_Y | ST_Slope_Flat | ST_Slope_Up |
|---|---|---|---|---|---|---|---|---|---|---|---|---|---|---|---|
| 40 | 140 | 289 | 0 | 172 | 0.0 | 0 | True | True | False | False | True | False | False | False | True |
| 49 | 160 | 180 | 0 | 156 | 1.0 | 1 | False | False | True | False | True | False | False | True | False |
| 37 | 130 | 283 | 0 | 98 | 0.0 | 0 | True | True | False | False | False | True | False | False | True |
| 48 | 138 | 214 | 0 | 108 | 1.5 | 1 | False | False | False | False | True | False | True | True | False |
| 54 | 150 | 195 | 0 | 122 | 0.0 | 0 | True | False | True | False | True | False | False | False | True |
Next, let’s analyze the correlations between our features and the target variable to identify the most important predictors:
correlations = abs(df_clean.corr())
plt.figure(figsize=(12,8))
sns.heatmap(correlations, annot=True, cmap="rocket_r")
plt.show()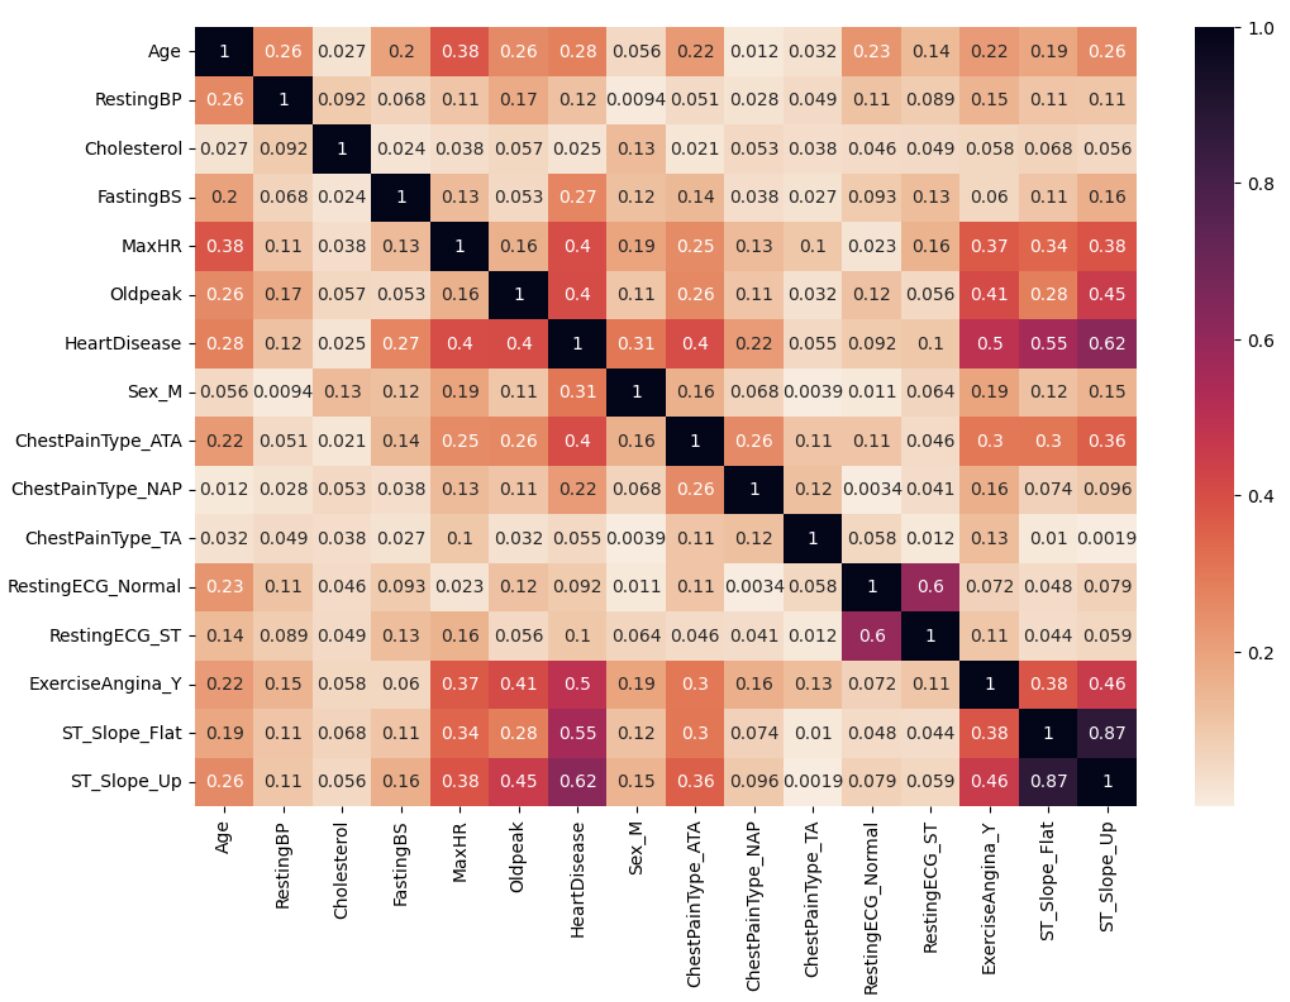

This heatmap shows the absolute correlations between all variables, but it’s hard to read. Let’s filter it to show only stronger correlations:
plt.figure(figsize=(12,8))
sns.heatmap(correlations[correlations > 0.30], annot=True, cmap="rocket_r")
plt.show()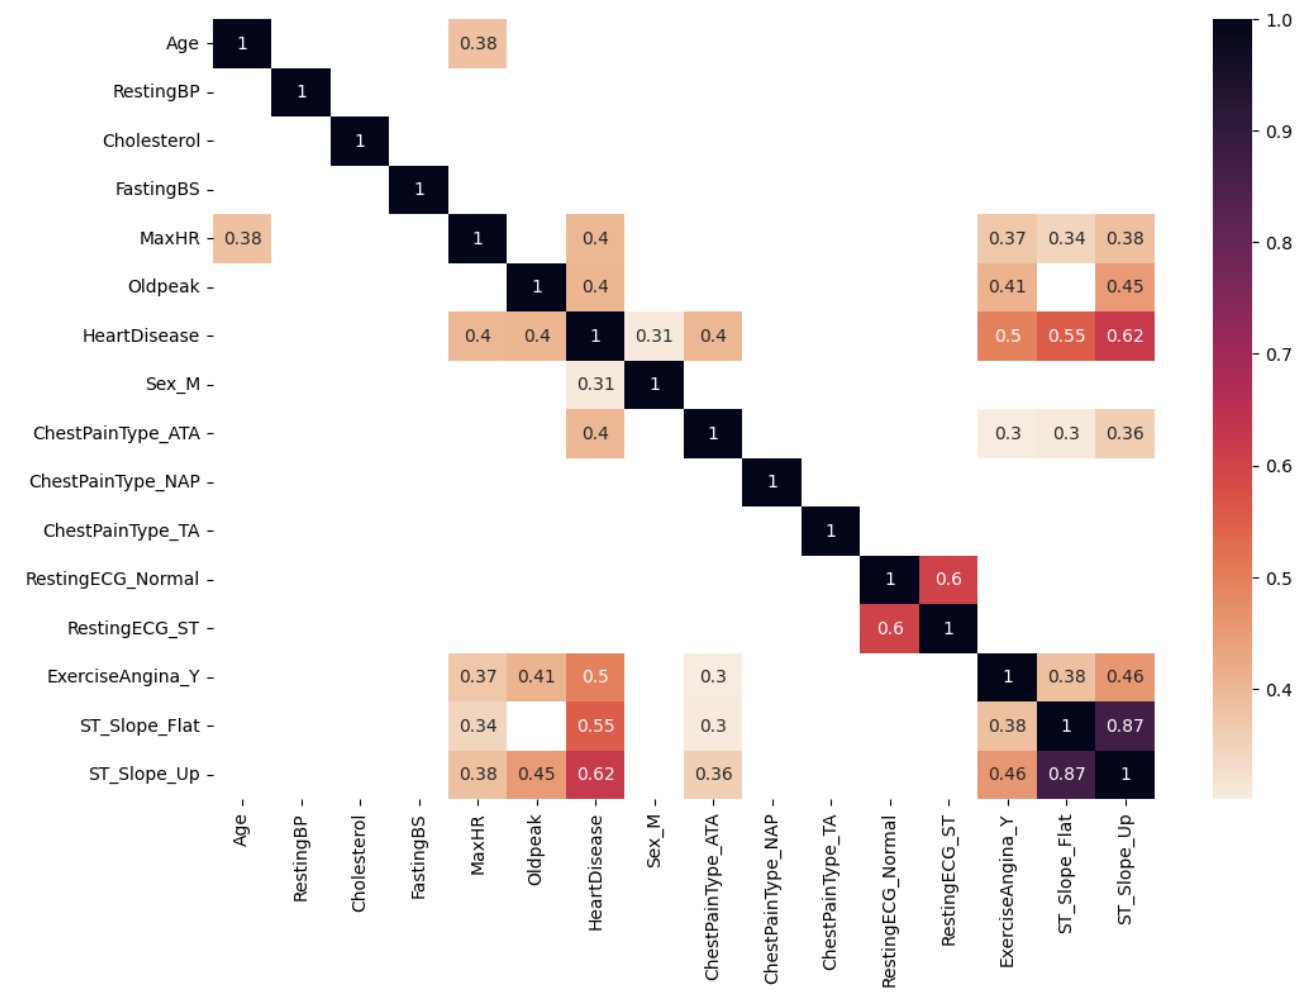

Based on these correlations, we can identify the features most strongly associated with heart disease:
- ST_Slope_Flat (0.52)
- ST_Slope_Up (0.51)
- Oldpeak (0.40)
- ExerciseAngina_Y (0.39)
- MaxHR (0.35)
- Sex_M (0.30)
Learning Insight: Feature selection is at the heart of building efficient and effective machine learning models. By focusing on features with stronger correlations to the target variable, we can create simpler models that generalize better to new data. The correlation threshold (0.30 in this case) is somewhat arbitrary and can be adjusted based on your specific dataset and requirements.
Building a Single-Feature Classifier
Before building our final model, let’s see how well each individual feature performs in predicting heart disease. This will give us a better understanding of their predictive power:
# Split data into training and validation sets
X = df_clean.drop(["HeartDisease"], axis=1)
y = df_clean["HeartDisease"]

X_train, X_val, y_train, y_val = train_test_split(X, y, test_size=0.15, random_state=417)

features = [
    "MaxHR",
    "Oldpeak",
    "Sex_M",
    "ExerciseAngina_Y",
    "ST_Slope_Flat",
    "ST_Slope_Up"
]

for feature in features:
    knn = KNeighborsClassifier(n_neighbors=3)
    knn.fit(X_train[[feature]], y_train)
    accuracy = knn.score(X_val[[feature]], y_val)
    print(f"The k-NN classifier trained on {feature} and with k = 3 has an accuracy of {accuracy*100:.2f}%")
The k-NN classifier trained on MaxHR and with k = 3 has an accuracy of 66.67%
The k-NN classifier trained on Oldpeak and with k = 3 has an accuracy of 76.81%
The k-NN classifier trained on Sex_M and with k = 3 has an accuracy of 44.93%
The k-NN classifier trained on ExerciseAngina_Y and with k = 3 has an accuracy of 73.19%
The k-NN classifier trained on ST_Slope_Flat and with k = 3 has an accuracy of 81.88%
The k-NN classifier trained on ST_Slope_Up and with k = 3 has an accuracy of 84.06%Interestingly, ST_Slope_Up is the single best predictor with an accuracy of 84.06%, followed by ST_Slope_Flat at 81.88%. This makes sense from a medical perspective, as the ST segment on an electrocardiogram is directly related to heart function.
Building a Multi-Feature Classifier
Now, let’s build a model using all of our selected features together. Since we’re using the K-Nearest Neighbors algorithm, which is based on distance calculations, we need to scale our features to ensure they contribute equally:
# Scale the features to the same range
scaler = MinMaxScaler()
X_train_scaled = scaler.fit_transform(X_train[features])
X_val_scaled = scaler.transform(X_val[features])

# Build and evaluate the model
knn = KNeighborsClassifier(n_neighbors=3)
knn.fit(X_train_scaled, y_train)
accuracy = knn.score(X_val_scaled, y_val)
print(f"Accuracy: {accuracy*100:.2f}")
Accuracy: 83.33Our multi-feature model achieves 83.33% accuracy, which is slightly lower than our best single-feature model. This suggests that some features might be adding noise rather than useful information.
Learning Insight: More features don’t always lead to better models. Sometimes, a simpler model with fewer, more predictive features can outperform a complex model. This is related to the bias-variance tradeoff in machine learning: complex models might overfit the training data and perform poorly on new data.
Hyperparameter Optimization
To improve our model, let’s explore different combinations of hyperparameters using GridSearchCV. We’ll also refine our feature selection by excluding Sex_M, which had the weakest correlation with heart disease:
# Prepare data for final model
X = df_clean.drop(["HeartDisease"], axis=1)
y = df_clean["HeartDisease"]

X_train, X_test, y_train, y_test = train_test_split(X, y, test_size=0.15, random_state=417)

features = [
    "Oldpeak",
    # "Sex_M",  # Testing whether this feature helps or hinders accuracy
    "ExerciseAngina_Y",
    "ST_Slope_Flat",
    "ST_Slope_Up"
]

scaler = MinMaxScaler()
X_train_scaled = scaler.fit_transform(X_train[features])

# Define hyperparameter grid
grid_params = {"n_neighbors": range(1, 20),
               "metric": ["minkowski", "manhattan"]
              }

# Perform grid search
knn = KNeighborsClassifier()
knn_grid = GridSearchCV(knn, grid_params, scoring='accuracy')
knn_grid.fit(X_train_scaled, y_train)

# Display best parameters
print(f"Best score: {knn_grid.best_score_*100:.2f}%")
print(f"Best parameters: {knn_grid.best_params_}")
Best score: 82.29%
Best parameters: {'metric': 'minkowski', 'n_neighbors': 11}GridSearchCV has found the optimal hyperparameters for our model: using the Minkowski distance metric with 11 nearest neighbors. The best score on the training data is 82.29%.
Model Evaluation on Test Set
Finally, let’s evaluate our optimized model on the test set, which we haven’t used yet:
# Scale test data
X_test_scaled = scaler.transform(X_test[features])

# Make predictions on test set
predictions = knn_grid.best_estimator_.predict(X_test_scaled)
accuracy = accuracy_score(y_test, predictions)
print(f"Model Accuracy on test set: {accuracy*100:.2f}%")
Model Accuracy on test set: 87.68%Our model achieves 87.68% accuracy on the test set, which is even better than its performance on the training data. This is somewhat unusual and suggests that our test set might happen to be easier to classify or more representative of the patterns the model learned.
Let’s check if there’s any significant difference in the distribution of our data between the training and test sets:
# Check distribution of Sex_M
print("Distribution of patients by their sex in the entire dataset")
print(X.Sex_M.value_counts())

print("\nDistribution of patients by their sex in the training dataset")
print(X_train.Sex_M.value_counts())

print("\nDistribution of patients by their sex in the test dataset")
print(X_test.Sex_M.value_counts())
Distribution of patients by their sex in the entire dataset
Sex_M
True 724
False 193
Name: count, dtype: int64
Distribution of patients by their sex in the training dataset
Sex_M
True 615
False 164
Name: count, dtype: int64
Distribution of patients by their sex in the test dataset
Sex_M
True 109
False 29
Name: count, dtype: int64The proportions look similar across the datasets, with approximately 80% male and 20% female patients in each set.
Finally, let’s visualize the model’s performance using a confusion matrix:
cf = confusion_matrix(y_test, predictions)
ConfusionMatrixDisplay(cf).plot()
plt.show()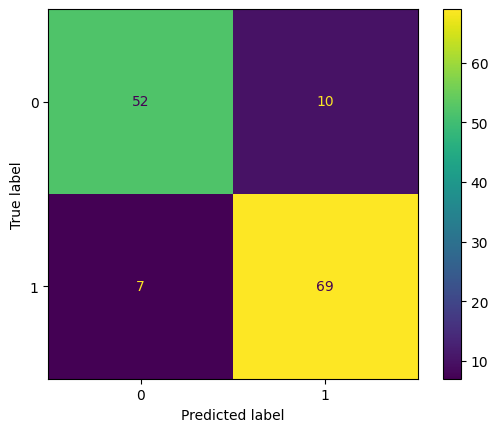

The confusion matrix shows:
- True Negatives (top-left): 52 patients correctly predicted as not having heart disease
- False Positives (top-right): 10 patients incorrectly predicted as having heart disease
- False Negatives (bottom-left): 7 patients incorrectly predicted as not having heart disease
- True Positives (bottom-right): 69 patients correctly predicted as having heart disease
Learning Insight: The confusion matrix provides deeper insights into model performance than accuracy alone. In a healthcare context, false negatives (predicting no disease when there is one) can be particularly concerning, as they might lead to missed diagnoses. Our model has 7 false negatives out of 76 patients with heart disease, which is a false negative rate of about 9.2%.
Recap
In this project, we’ve built a K-Nearest Neighbors model that predicts heart disease with approximately 88% accuracy. We followed a complete machine learning workflow:
- Data Understanding: We examined the structure and content of our dataset
- Data Visualization: We used plots to identify patterns and relationships
- Data Cleaning: We handled invalid values for RestingBP and Cholesterol
- Feature Engineering: We converted categorical variables to numeric using one-hot encoding
- Feature Selection: We identified the most predictive features using correlation analysis
- Model Building: We trained models on individual features and combinations of features
- Hyperparameter Tuning: We optimized our model using GridSearchCV
- Model Evaluation: We assessed our model’s performance on a separate test set
Next Steps
Despite achieving good accuracy, there are several ways we could potentially improve our model:
- Explore Different Features: Test different combinations of features to see if we can improve performance
- Try Different Random States: The random state in train_test_split affects how data is divided, which can impact results
- Address Class Imbalance: The dataset has significantly more male than female patients, which could bias our model
- Try Different Models: Compare KNN with other algorithms like logistic regression, random forests, or gradient boosting
Final Thoughts
This project demonstrates the power of machine learning in healthcare applications. While our model shows promise, it’s important to note that real-world medical diagnoses involve many factors beyond what’s captured in this dataset. Any predictive model should be used as a tool to support, not replace, clinical judgment.
If you’re new to Python and do not feel ready to start this project, our Python Basics for Data Analysis course will help you master the foundational skills needed for this project. The course covers essential topics like loops, conditionals, and data manipulation with pandas that we’ve used extensively in this analysis. Once you’re comfortable with these concepts, come back to build your own heart disease prediction model and take on the enhancement challenges!
Happy coding!
Source link


